
Numbers that point you in the right direction of your next move
Every platform in one view, the posts ranked by what actually performed, and a written report the client opens from a link.
What it takes off your hands
- Exporting a CSV from each platform
- Screenshots pasted into a slide deck
- “How did we do?” answered with a shrug
- A monthly report that takes an afternoon
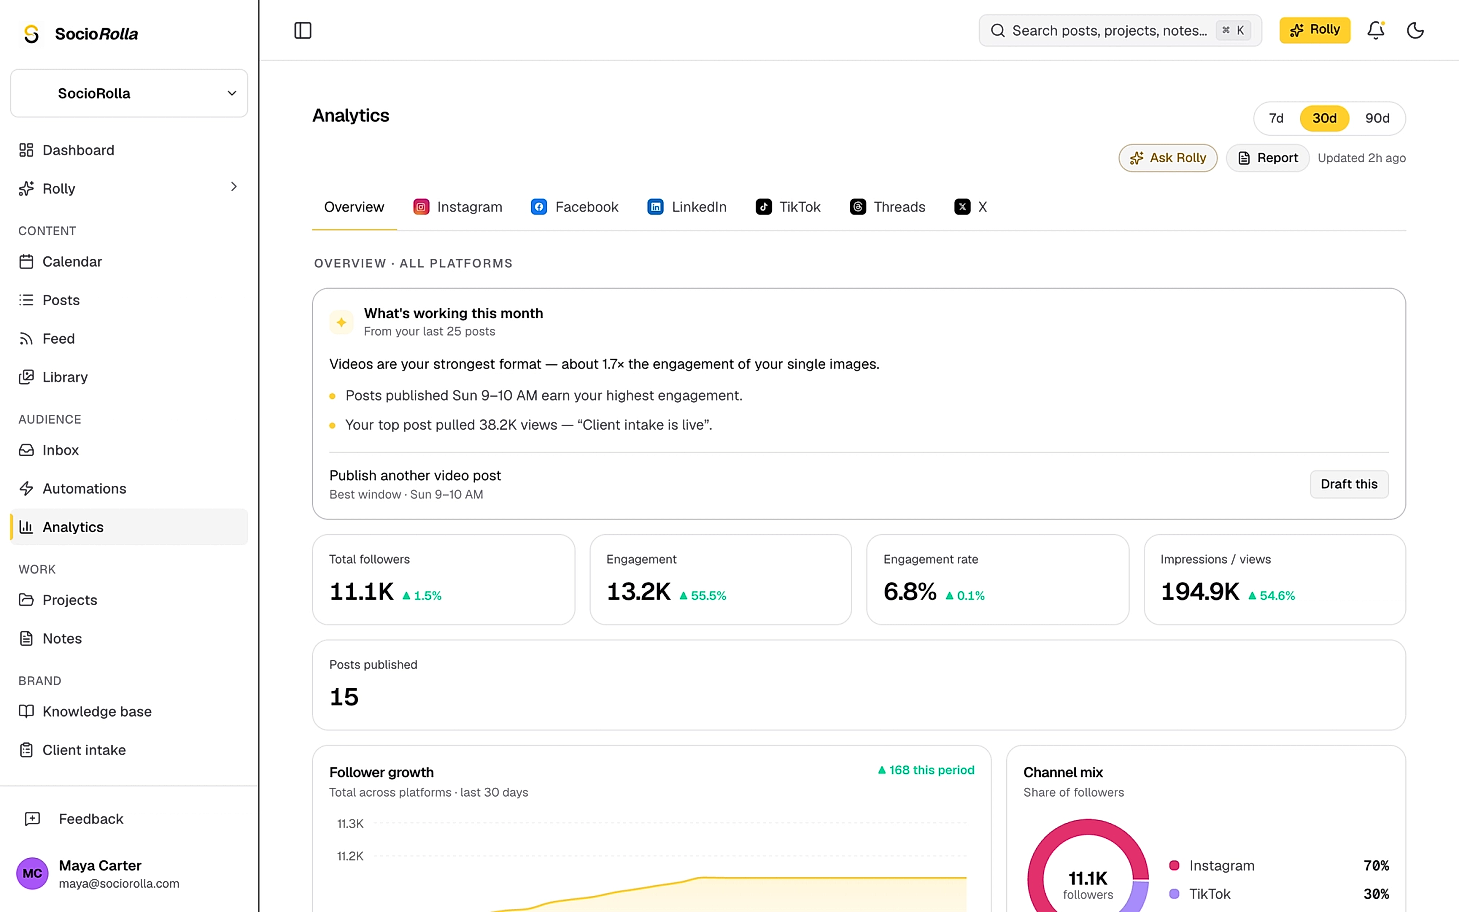
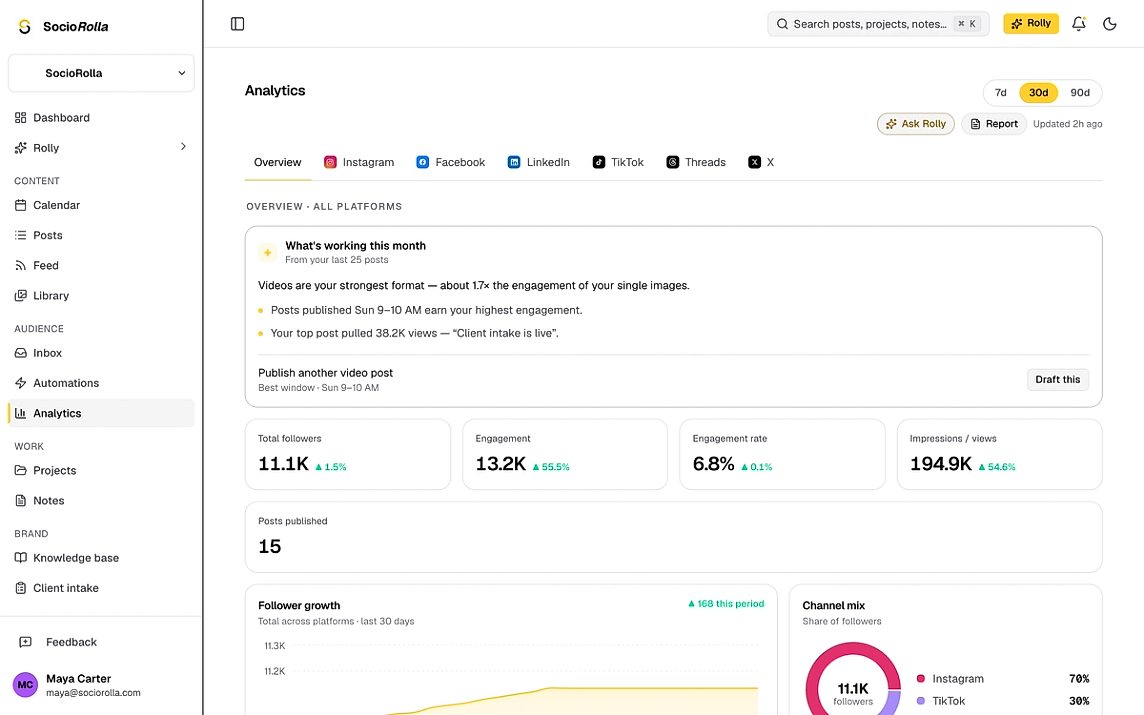
- All platforms in one view, refreshed daily
- Top posts ranked by engagement rate, not by guess
- A written read on what worked, from your own posts
- A client report, written and shared as a link or PDF
A summary before the charts
Every brand gets a short written digest from its own last ninety days of posting: which format is pulling ahead, which window earns the most engagement, and which post ran away with the month. One of them comes with a button that starts the next draft.
- Written from your posts, not from a benchmark
- Names the post, the format and the window
- Needs about ten published posts to say anything
- On Pro and Max
Ten posts, ranked honestly
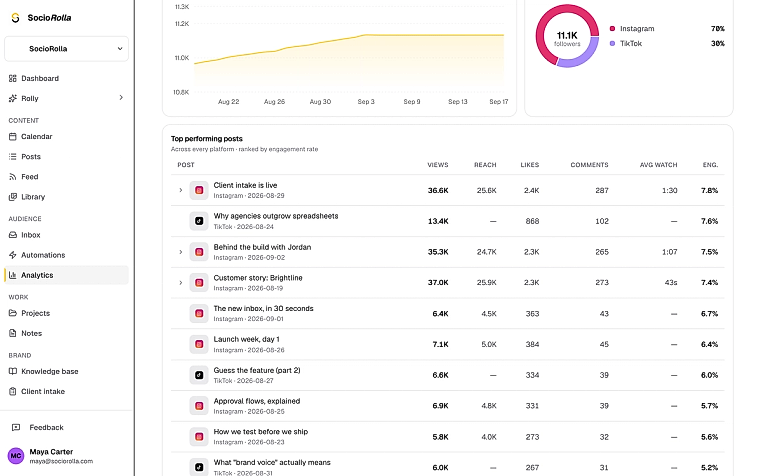
Top posts are ranked by engagement rate across every platform, and each one can tell you why it did well.
- Views, reach, likes, comments and average watch, where the platform reports them
- A rate we cannot trust is left blank, and the post sorts last
- Reach shows only where it is real: Instagram and Facebook
What each platform actually reports
Views, likes, comments and shares come from all six. The rest depends on what the platform gives us, and we would rather show you this table than a dashboard full of zeroes.
- Reach, Saves, Profile visits and follows, Average watch time, Audience demographics
- Reach, Video views, Link clicks, Average watch time
- Link clicks, Audience demographics
- TikTok
- Video views
- Threads
- Audience demographics
- X
- Saves, Link clicks
Four rules we do not break
Reach is never added up
The same person is counted on each platform, so a combined reach would only be a bigger number. Views combine; reach stays per post.
A number we cannot trust is withheld
When a platform’s own counting makes an engagement rate impossible, the rate is left blank rather than printed.
A change is only shown when it means something
No “+2,485%” because last month had three posts. Small bases and thin periods show no delta at all.
Nothing is estimated
A metric we do not have reads “not available”. It never reads zero.
Your best windows, from your own posts
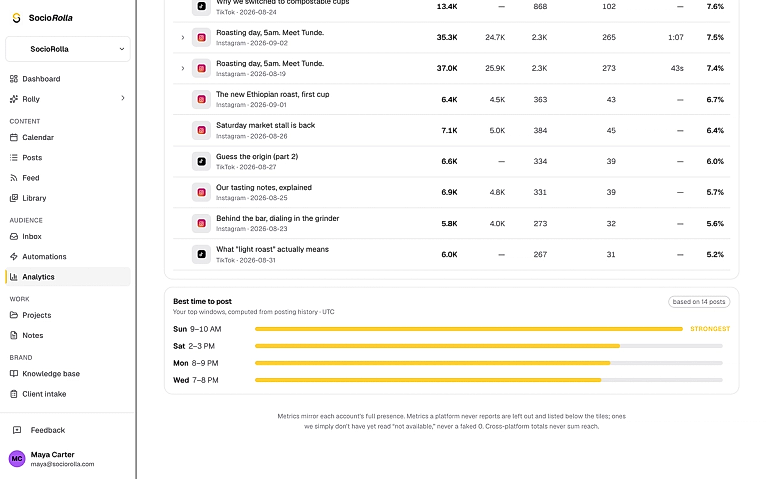
No platform will tell you when your audience is awake, so this is computed from ninety days of your own posting: every weekday and hour scored by the engagement it earned, in the brand’s timezone.
- The strongest hour of each day, four windows deep
- In the brand’s timezone, and the card says which
- Appears once you have roughly fifteen published posts
The report your client actually opens
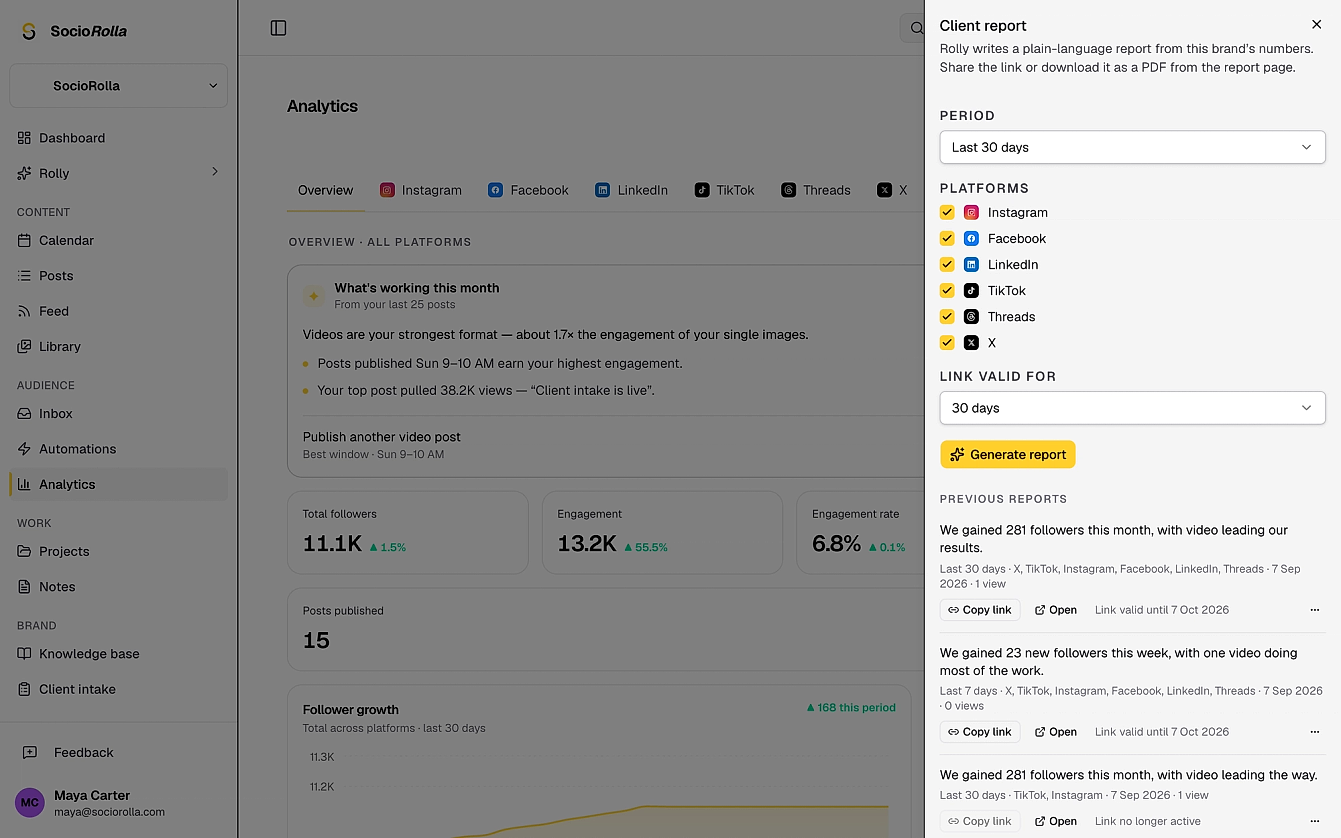
Pick the period and the platforms; Rolly writes the summary from that brand’s numbers. The client gets a link, not an attachment, and the page opens without an account.
- What happened, why, and what you will do next
- Followers, views, engagement and the top ten posts
- A link that lasts seven, thirty or ninety days
- Renew it, revoke it, or see how many times it was opened
- Download it as a PDF from the same page
- Your logo and colour on the page, on Max
- A monthly report prepared for you, and emailed to your client once you approve it
- Refresh
- Once a day, every connected account
- Ranges
- Seven, thirty or ninety days
- At connect
- Up to 90 days and 200 posts are pulled in
Everything in insights
- One overview, plus a tab per connected platform
- Followers, engagement, engagement rate, views and posts published
- Follower growth and channel mix
- Top ten posts, ranked by engagement rate
- Best times to post, from your own history
- Audience age, gender and countries where the platform reports them
- A written digest of what is working
- Client reports, shared as a link or saved as a PDF
Questions about the numbers
They are refreshed once a day. The follower line starts the day an account is connected, because no platform hands over yesterday’s follower count.
Keep exploring
Manage accounts without the overwhelm
Bring one brand or twelve; SocioRolla helps you keep up.